USO vs WTI: being a Cheapo and front running ETF rolls?
Since the latest US-Iran conflict began earlier this year, oil has been getting a lot more attention. I’ve even had a few friends outside the commodities and finance world ask me how they can trade oil as retail investors.
Btw Brent is the crude benchmark more affected vs WTI by this conflict, but I focus on USO here as it is the more liquid ETF traded by retail vs BNO.
The US-Iran war is making everyone interested in Oil again
This chart gives a good summary of how oil price has been directly impacted by what is happening in the Middle East:
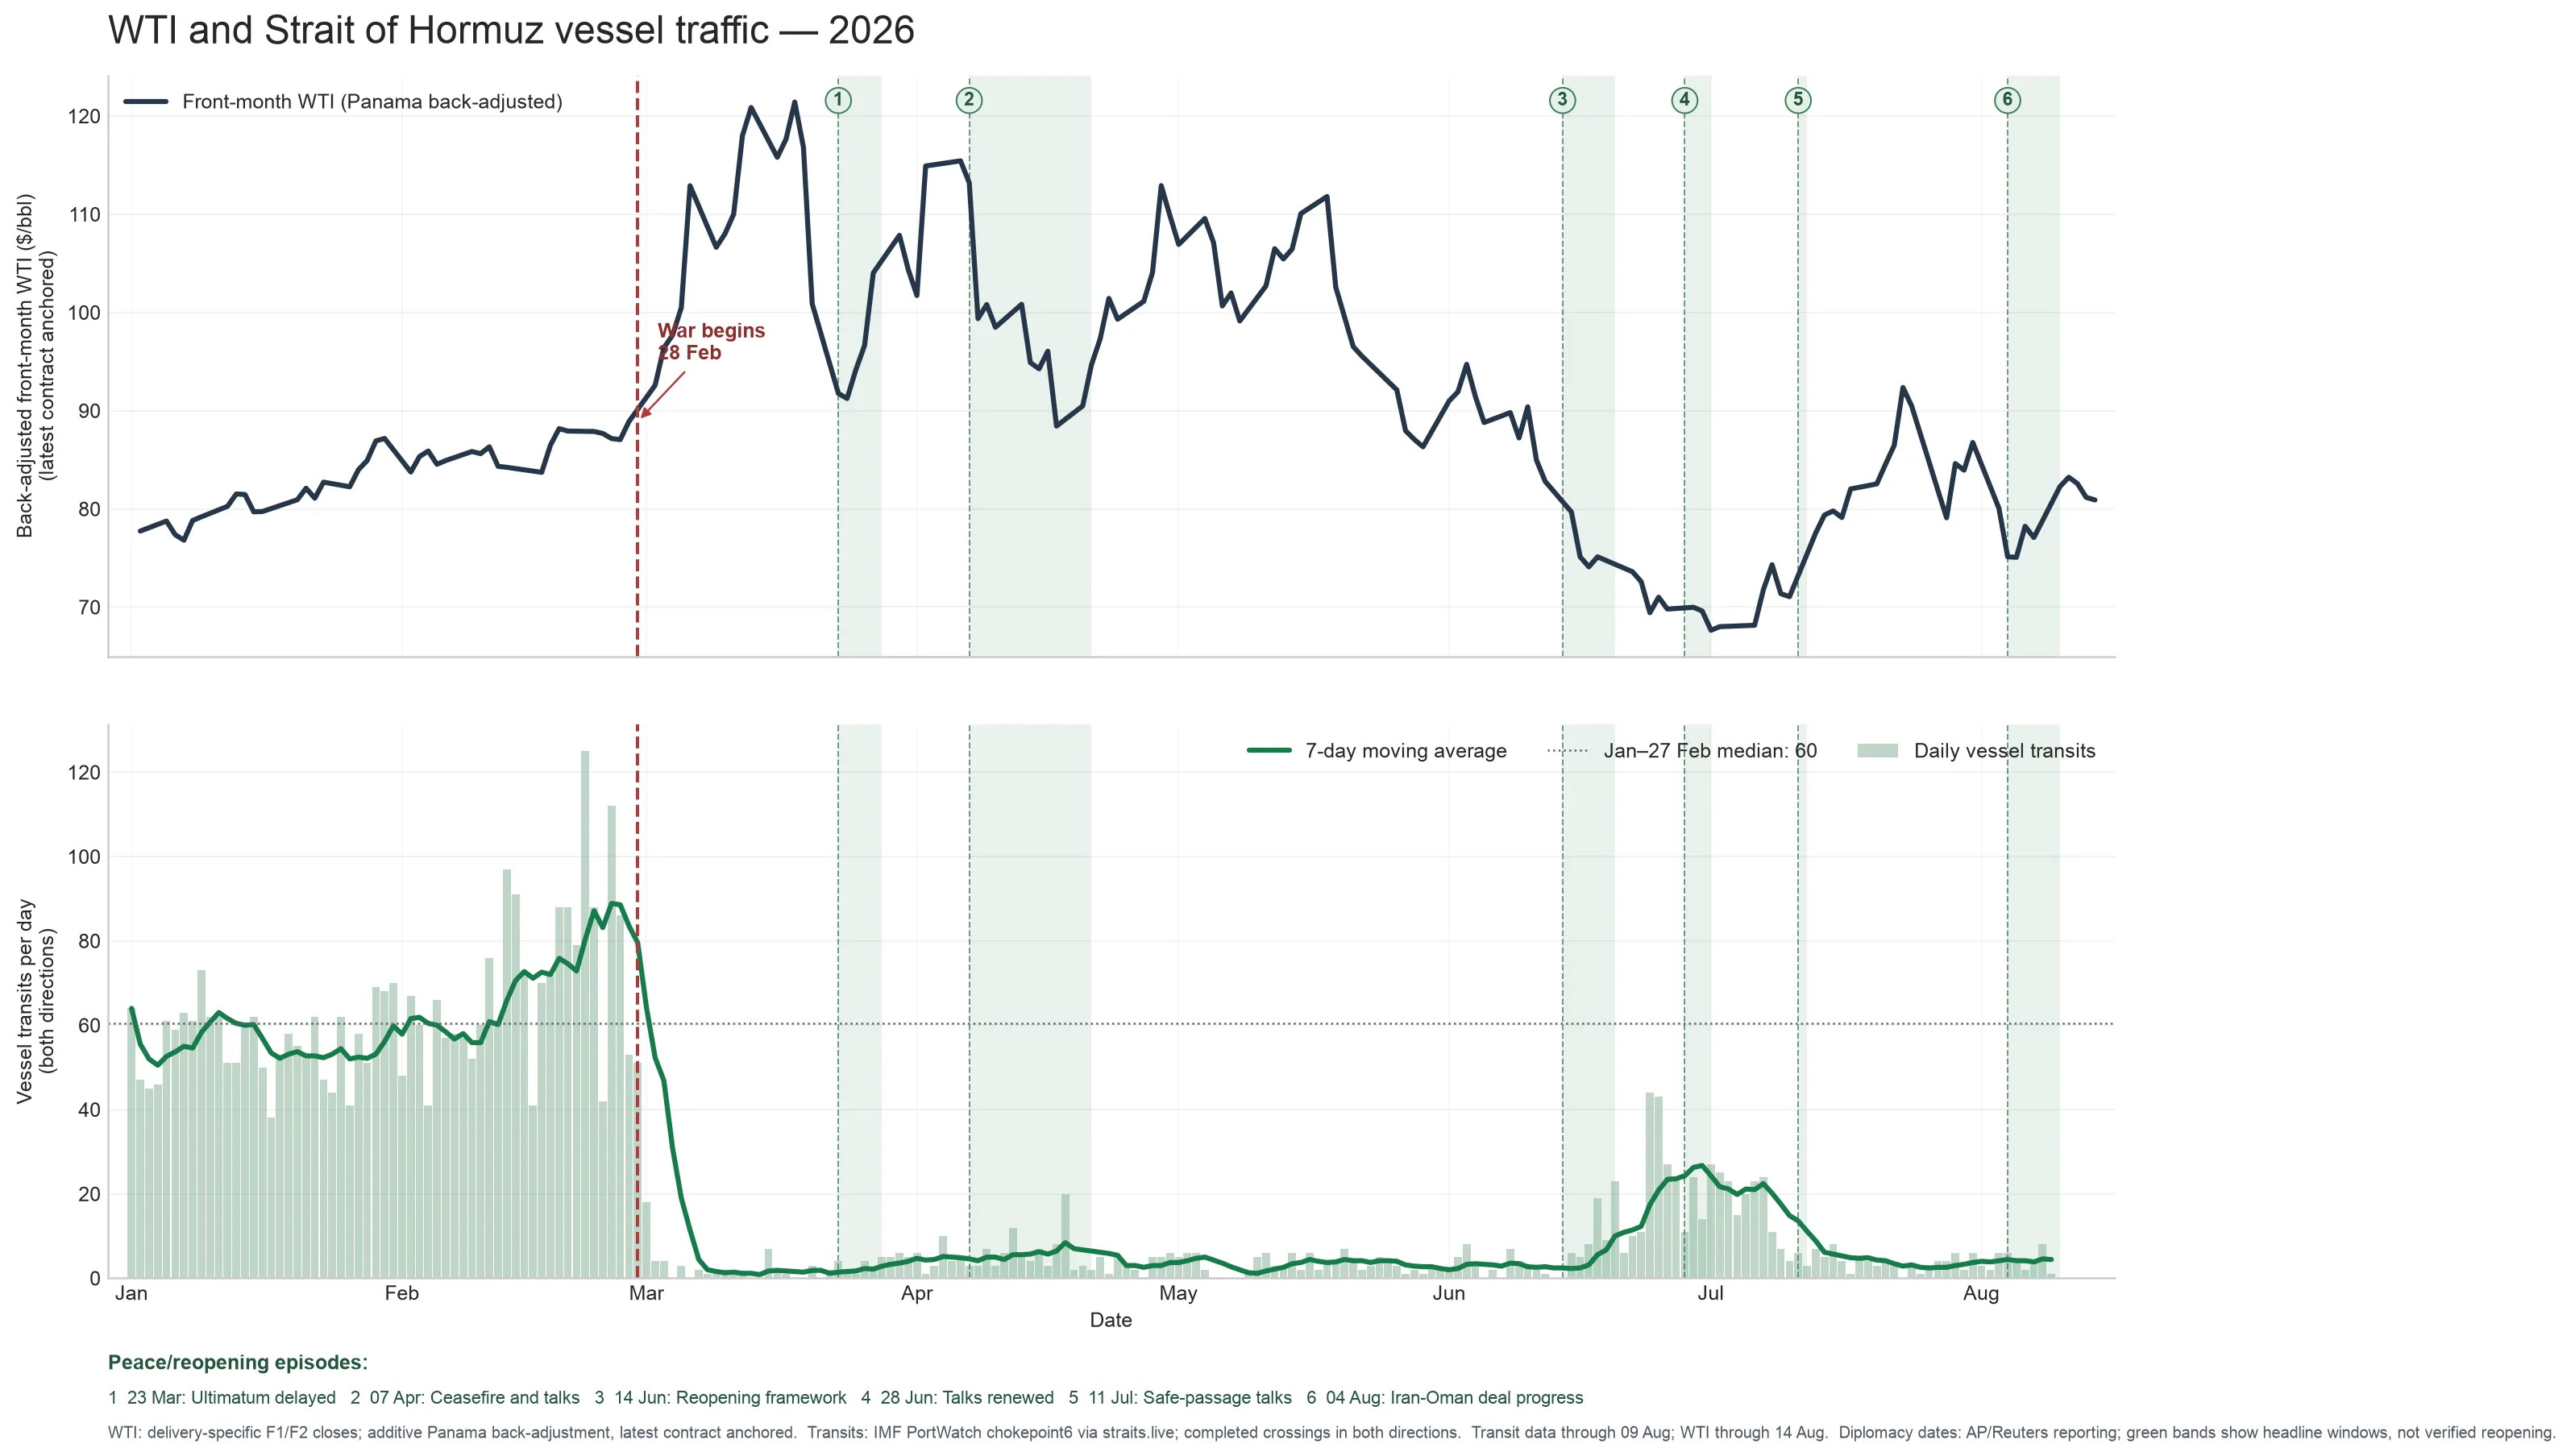
Shoutout to Straits and IMF PortWatch for transit data, which AI found by itself.
The six green bands group periods when public reporting focused on ceasefires, negotiations, safe passage or reopening the strait that were picked up by my AI agent:
View the six highlighted windows and their sources
| # | Window | Why it is highlighted | Main source |
|---|---|---|---|
| 1 | 23–28 March | The United States delayed threatened strikes for five days after saying that productive conversations had included reopening Hormuz; Iran disputed that direct talks had occurred. | Reuters reporting via Al Jazeera |
| 2 | 7–21 April | A two-week US-Iran ceasefire included a reopening commitment and was followed by face-to-face talks and a ceasefire extension. | Associated Press timeline |
| 3 | 14–20 June | A preliminary reopening framework was announced, followed by a 60-day memorandum committing both sides to begin reopening the strait while broader talks continued. | Al Jazeera |
| 4 | 28 June–1 July | The United States and Iran halted a renewed round of attacks and restarted talks over Hormuz. | Reuters via Investing.com |
| 5 | 11–12 July | The Iranian and Omani foreign ministers discussed safe-passage arrangements as the United States sought free and secure transit. | Reuters via MarketScreener |
| 6 | 4–10 August | Iran and Oman reported progress toward a temporary reopening arrangement, although Iranian conditions continued to complicate implementation. | Associated Press |
WTI price here is represented by a Panama back-adjusted continuous front-month series. There's plenty of online resources explaining exactly how it works, but basically it is to account for artificial jumps cause by changing contracts (since futures contracts have expiry dates). Main thing to note here is that in a Panama back-adjustment, the latest contract is left unchanged but earlier values are synthetic, which fits our purposes here as we just care about reading the trend.
USO vs WTI futures vs WTI spot
Evidently there is a difference between USO vs WTI futures vs WTI spot. As we can see from their differing closing prices on 11 Aug:
| Instrument | Aug. 11, 2026 price | Measure |
|---|---|---|
| WTI spot | $84.77/bbl | EIA daily Cushing WTI spot observation (U.S. Energy Information Administration) |
| WTI front-month futures: Sep-26 CL (CLU26) | $83.20/bbl | NYMEX settlement price (The Wall Street Journal) |
| USO | $127.61/share | NYSE Arca closing price (Investing.com) |
This is a crash course for my non-commodities friends:
WTI spot is not tradable. It is a cash-market price for physical crude oil at/around Cushing, Oklahoma.
If you want oil exposure in your personal account, the easiest way in is via United States Oil Fund USO, which is an ETF. There is also the option if you are a bit more ballsy to punt with Micro WTI Crude Oil Futures MCL which is the micro contract for the physically deliverable CL.
From a practical perspective, USO has lower barriers to entry. You can buy USO via a regular brokerage account like a stock or ETF and you can buy as little as just 1 share, which currently is around 125USD, in which case your max loss will be just 125USD. If you want to hold an oil long over a few months, you can technically just buy USO and go to sleep.
On the other hand, trading MCL requires a lot more effort in understanding margins and rolling. If price moves against you, you need to keep topping up to maintain margins, otherwise you might get liquidated. If you want to hold a long view over a few months and your long is in the front month contract, you will need to roll that position.
On a fundamental level, USO also states explicitly: AN INVESTMENT IN USO SHOULD NOT BE VIEWED AS AN INVESTMENT IN THE BENCHMARK OIL FUTURES CONTRACT OR LIGHT SWEET CRUDE OIL.
So what is the difference between USO and WTI futures?
The difference is in the return generated from roll yield and collateral interest.
Excess Returns (ER) = futures price return + roll yield
Total Returns (TR) = ER + collateral interest
USO gives investors something closer to TR, less the funds expenses.
If you are a total cheapo and refuse to pay the 0.45% management fee and approx 0.86% annual operating expenses for USO, you could technically approximate the exposure by trading and rolling the WTI futures yourself.
Roll yield is the gain or loss created when an expiring futures contract is replaced with a later-dated contract. Hence, the shape of the futures curve matters: in backwardation, the next contract is cheaper than the expiring contract = positive roll yield; in contango, the next contract is more expensive = negative roll yield and can drag on returns. USO likes backwardation.
Step 1: Constructing the front-month benchmark Excess Return
I reconstruct USO’s published benchmark schedule with delivery-specific contracts.
The historical rules are:
- January 2011 - April 2020: a four-day roll beginning two calendar weeks before the nearest contract’s last trading day. Incoming-contract weights were 25%, 50%, 75% and 100%.
- May 2020 - December 2025: a ten-trading-day roll beginning on the first trading day of each month. The incoming weight increased by approximately 10 percentage points per day.
- January 2026 onward: a five-trading-day roll beginning on the first trading day of each month. The incoming weight increases by approximately 20 percentage points per day.
For the 2026 rule, the benchmark exposure during a normal roll is therefore:
| Roll day | Outgoing contract | Incoming contract |
|---|---|---|
| Before roll | 100% | 0% |
| 1 | 80% | 20% |
| 2 | 60% | 40% |
| 3 | 40% | 60% |
| 4 | 20% | 80% |
| 5 | 0% | 100% |
The daily excess return is the percentage change in the weighted price basket specified for that calculation date:
Daily benchmark ER = today’s weighted contract-price basket ÷ yesterday’s same-contract weighted price basket − 1
The same roll weights are used in both baskets, and every price comparison follows the same delivery month. For example, on the second day of the 2026 roll, both today’s basket and yesterday’s basket contain 60% of the outgoing contract and 40% of the incoming contract. This follows USO’s filing-defined benchmark formula; it is slightly different from averaging the two contracts’ percentage returns.
Step 2: Constructing the front-month benchmark Total Return
The total-return benchmark adds interest earned from collateral, on top of excess return.
Gross daily TR = (1 + daily benchmark ER) × (1 + daily collateral return) − 1
I use the 3m U.S. Treasury yield from FRED as a collateral proxy. I take the most recently observed annual yield and accrue it over the actual number of calendar days between observations. A one-day trading interval receives one day of interest; a Friday-to-Monday interval receives three days.
For example, if the annual yield is 5%, the one-day collateral growth factor is 1.05 raised to the power of 1/365. Over a three-day weekend, the exponent becomes 3/365.
Results: USO vs Reconstructed Front-Month Benchmark vs WTI spot with 100$ at the start of 2026
The chart below begins with $100 at the first synchronized close of 2Jan2026 to 11Aug2026:
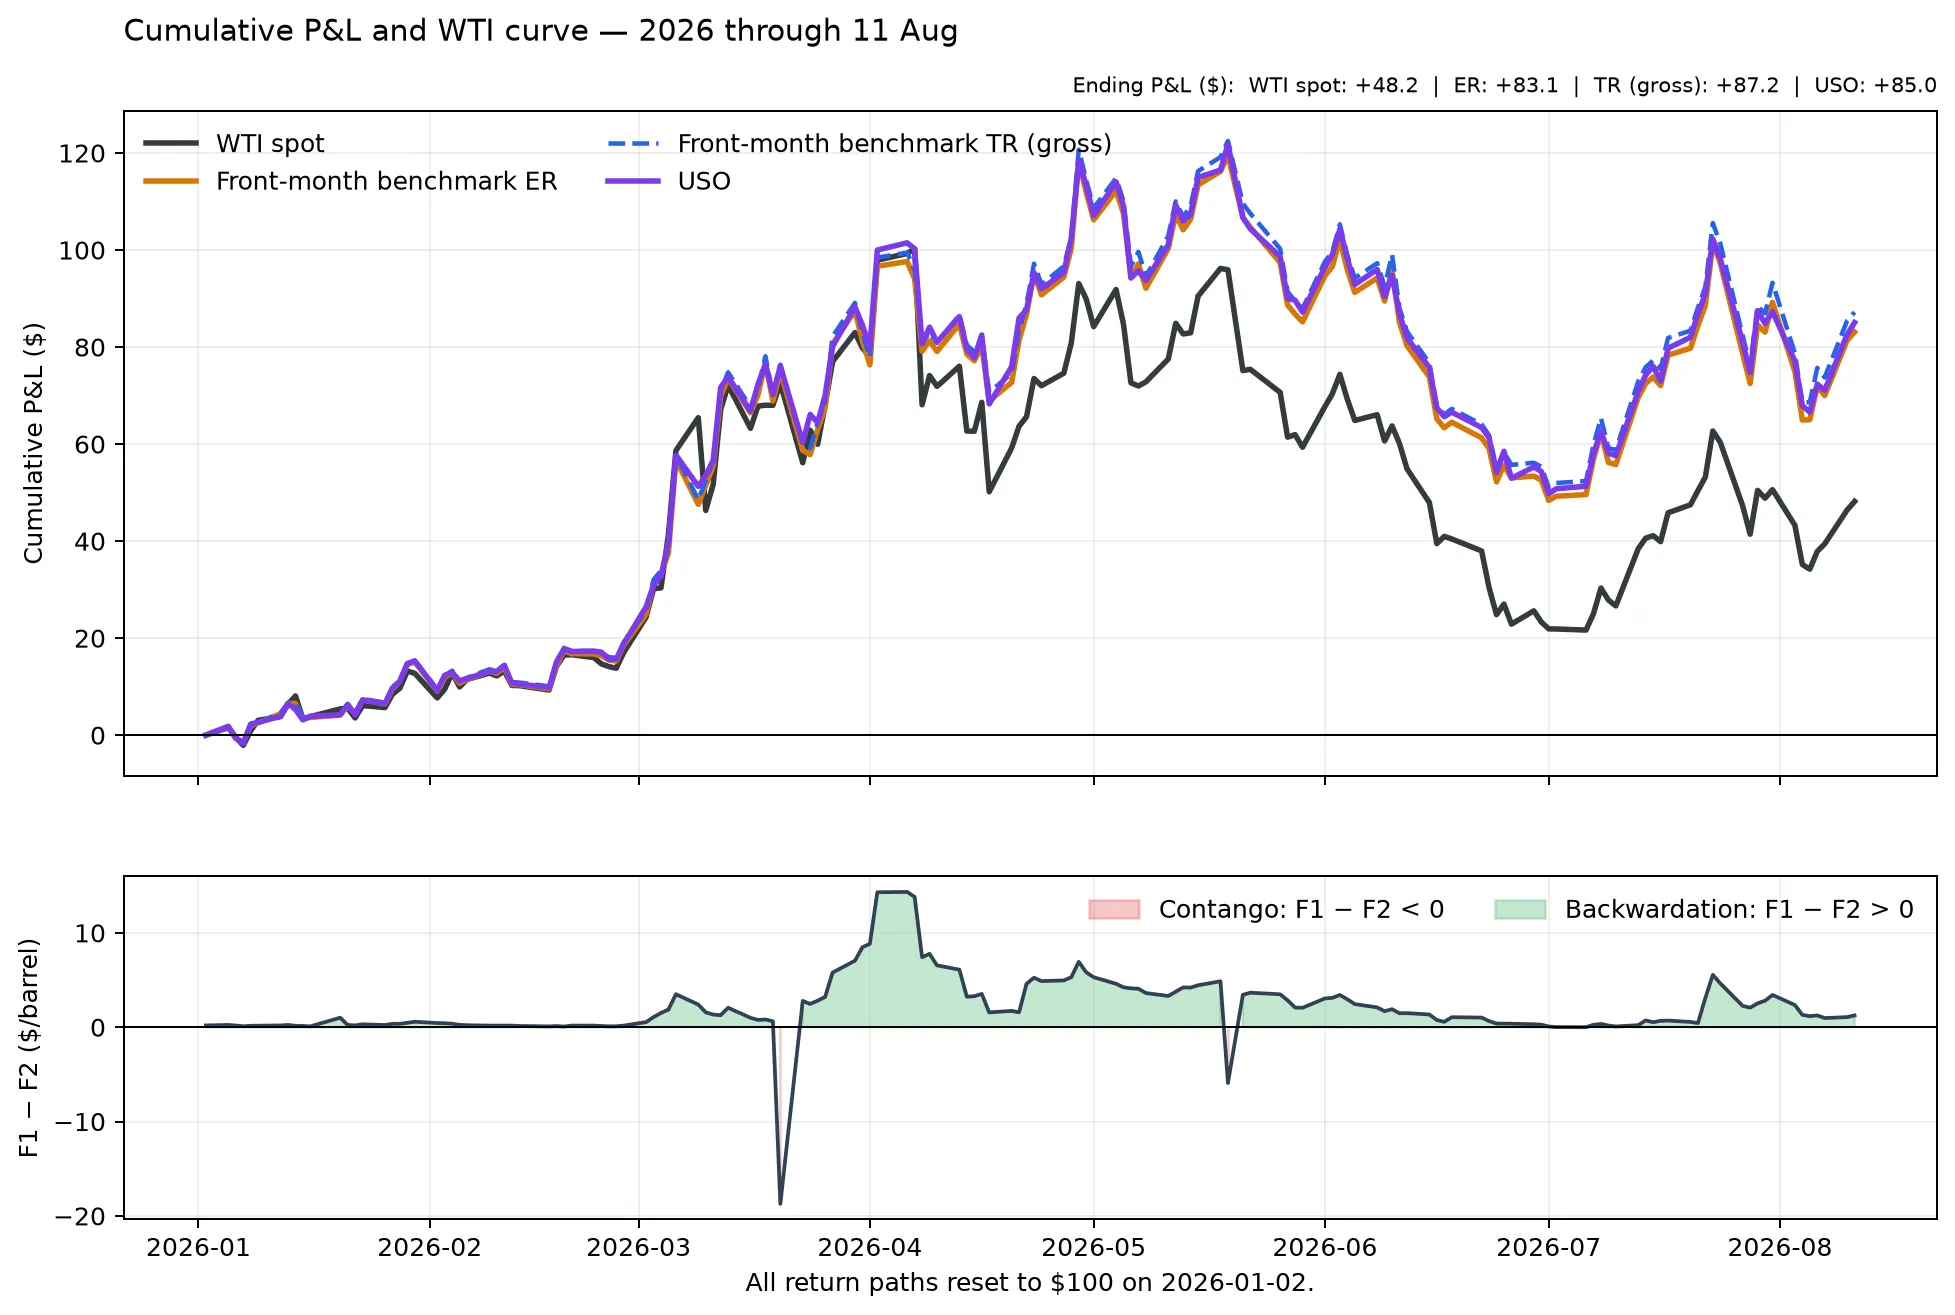 The results make sense, with our reconstructed front-month benchmarks tracking closely to USO. And we see a win for the cheapos, with our reconstructed TR slightly edging out USO returns.
In an idealised world where we executed the front-month benchmark TR, we would have made $2.14 more on every $100 by being a cheapo. But this assumes execution at official settlement prices, with no commissions, bid-ask spread or slippage.
| Investment | Ending value of $100 | Cumulative P&L |
|---|---|---|
| Front-month benchmark TR (gross) | $187.19 | +$87.19 |
| USO | $185.05 | +$85.05 |
| Difference | $2.14 | 2.14% of starting capital |
From the F1-F2 chart, we can also eyeball that most of the excess return in USO this year has been driven by backwardation in the WTI futures curve.
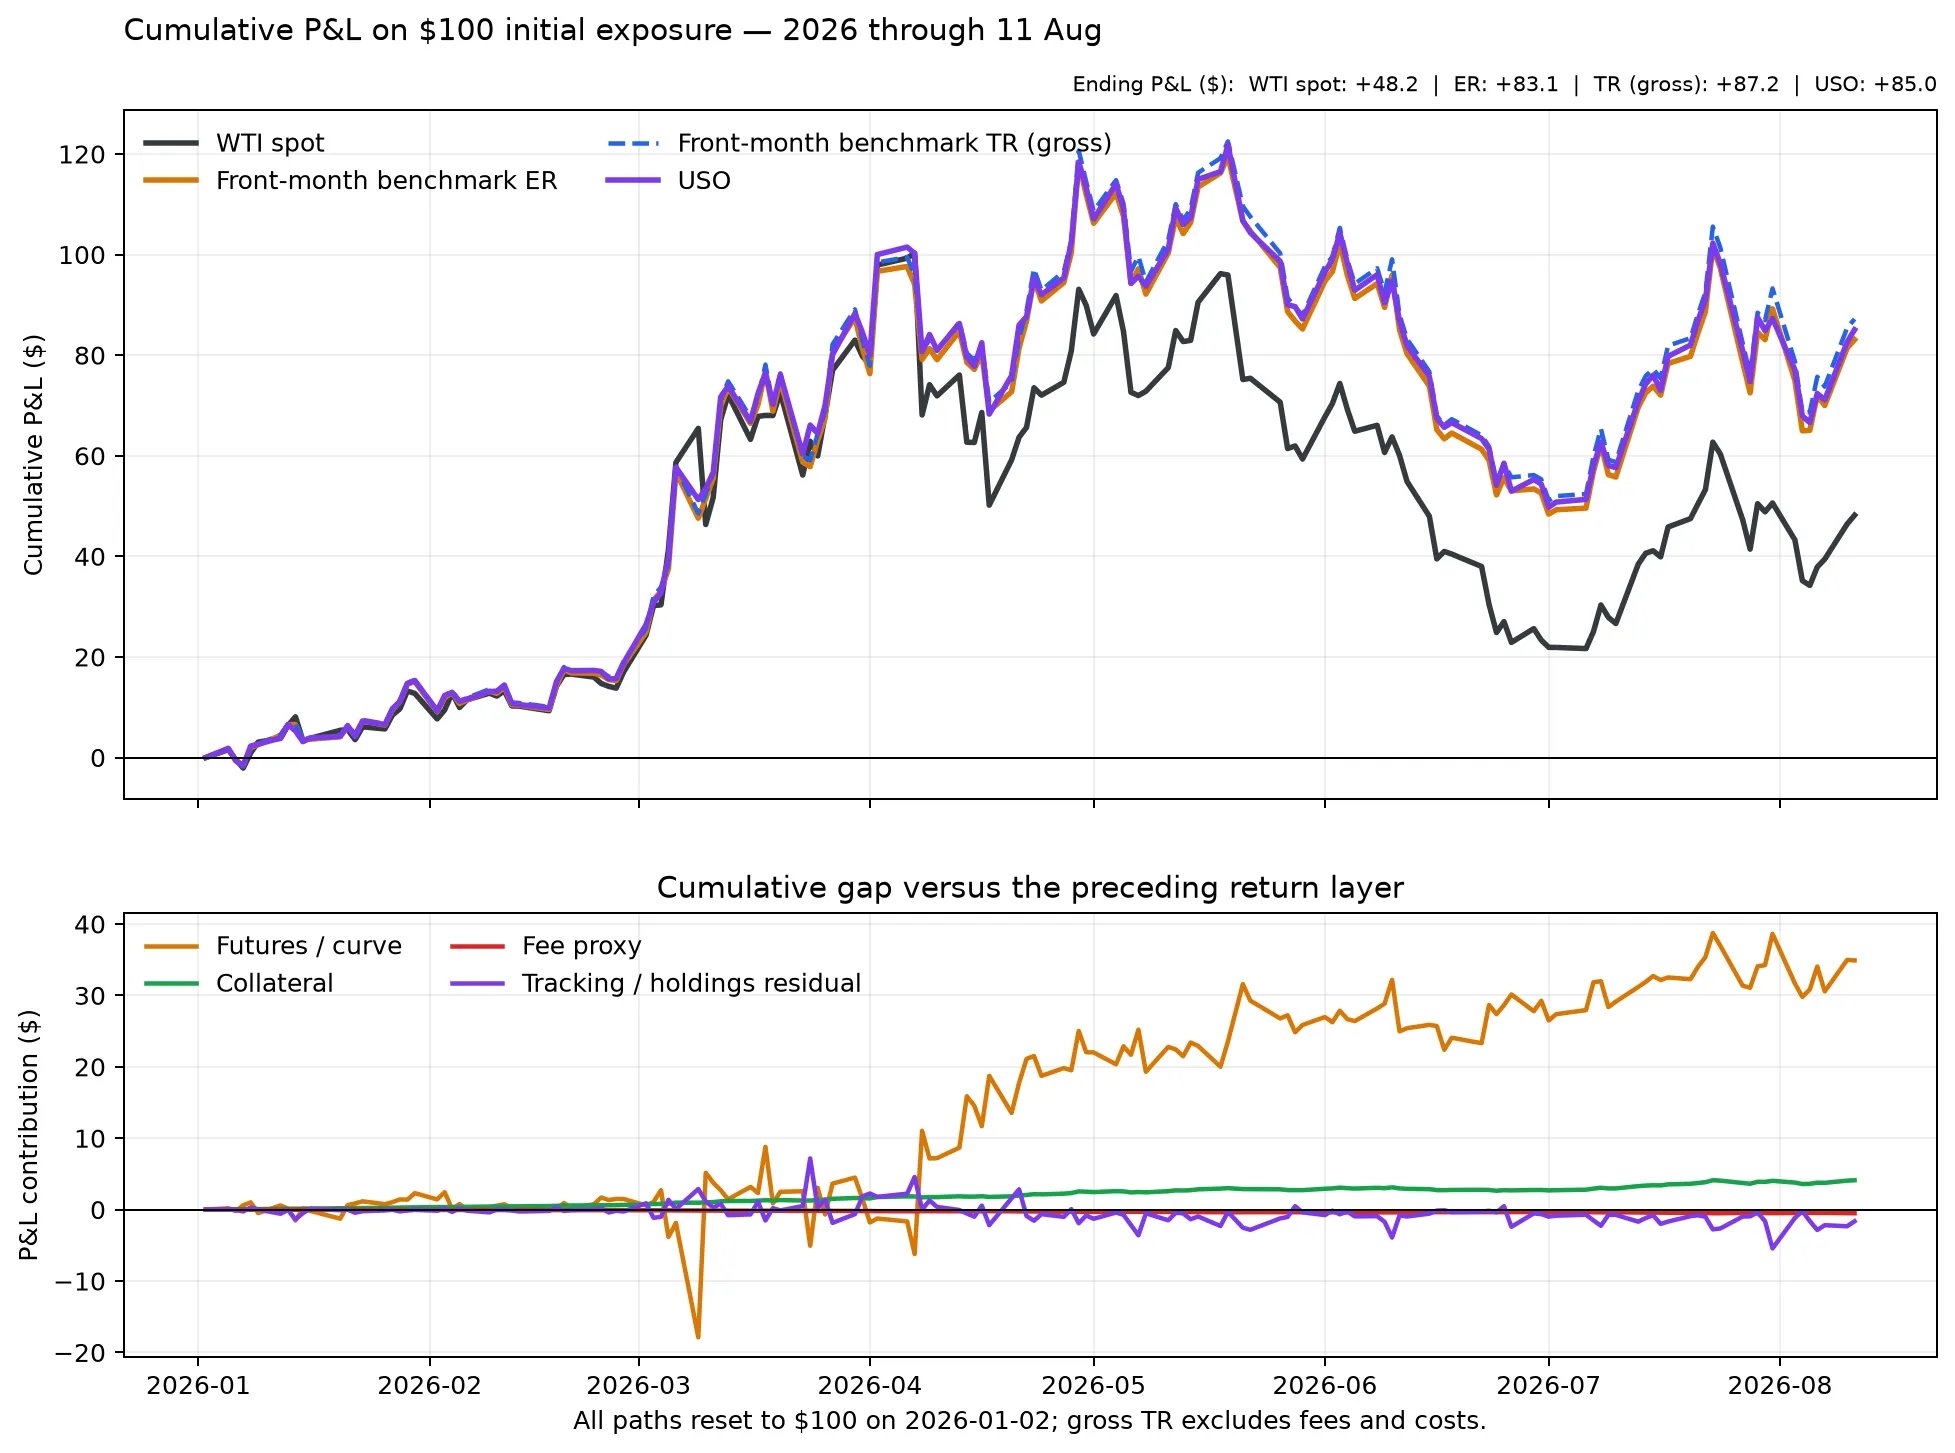
I also find it useful to view the same $100 paths broken down by component:
- Futures/curve: front-month benchmark ER minus WTI spot.
- Collateral: gross benchmark TR minus benchmark ER.
- Fee proxy: the estimated management-fee drag.
- Tracking/holdings residual: the remaining gap between fee-adjusted benchmark TR and observed USO.
Pre-emptive Rolling: Can an investor profit by rolling before USO’s published benchmark?
Now the interesting part.
USO’s roll schedule is public. The number of contracts of WTI futures it holds is also public. That leads naturally to a front-running hypothesis.
During a roll, the benchmark sells the outgoing contract and buys the incoming contract. If those trades create predictable pressure, the outgoing contract might weaken and the incoming contract might strengthen. An investor could try to move into the incoming contract first.
I tested that by constructing four new excess-return benchmarks that are identical to the published strategy except that the entire roll schedule occurs one, two, three or four trading days earlier.
We then compare the pre-emptive roll’s performance vs USO on an Excess Return vs Excess Return basis.
For each period, I started both strategies at $100 and applied their daily excess returns:
Early strategy value = $100 × (1 + day 1 return) × (1 + day 2 return) × …
The same calculation was done for the published-roll strategy. I then calculated:
Relative performance = early strategy’s ending value ÷ published strategy’s ending value − 1
For example, suppose:
- Early-roll strategy ends at $80.
- Published-roll strategy ends at $76.
The calculation is:
$80 ÷ $76 − 1 = 5.26%
So in this example, the early roll outperformed by 5.26%, even though it lost 20% in absolute terms. The daily returns were compounded rather than simply added together.
I split the daily history into three periods, since we all know the world went crazy in 2020 (cough, negative prices):
- January 2011 through December 2019;
- January through December 2020;
- January 2021 through the latest observation.
Results: pre-emptive rolling might have worked pre-2020, but maybe not anymore
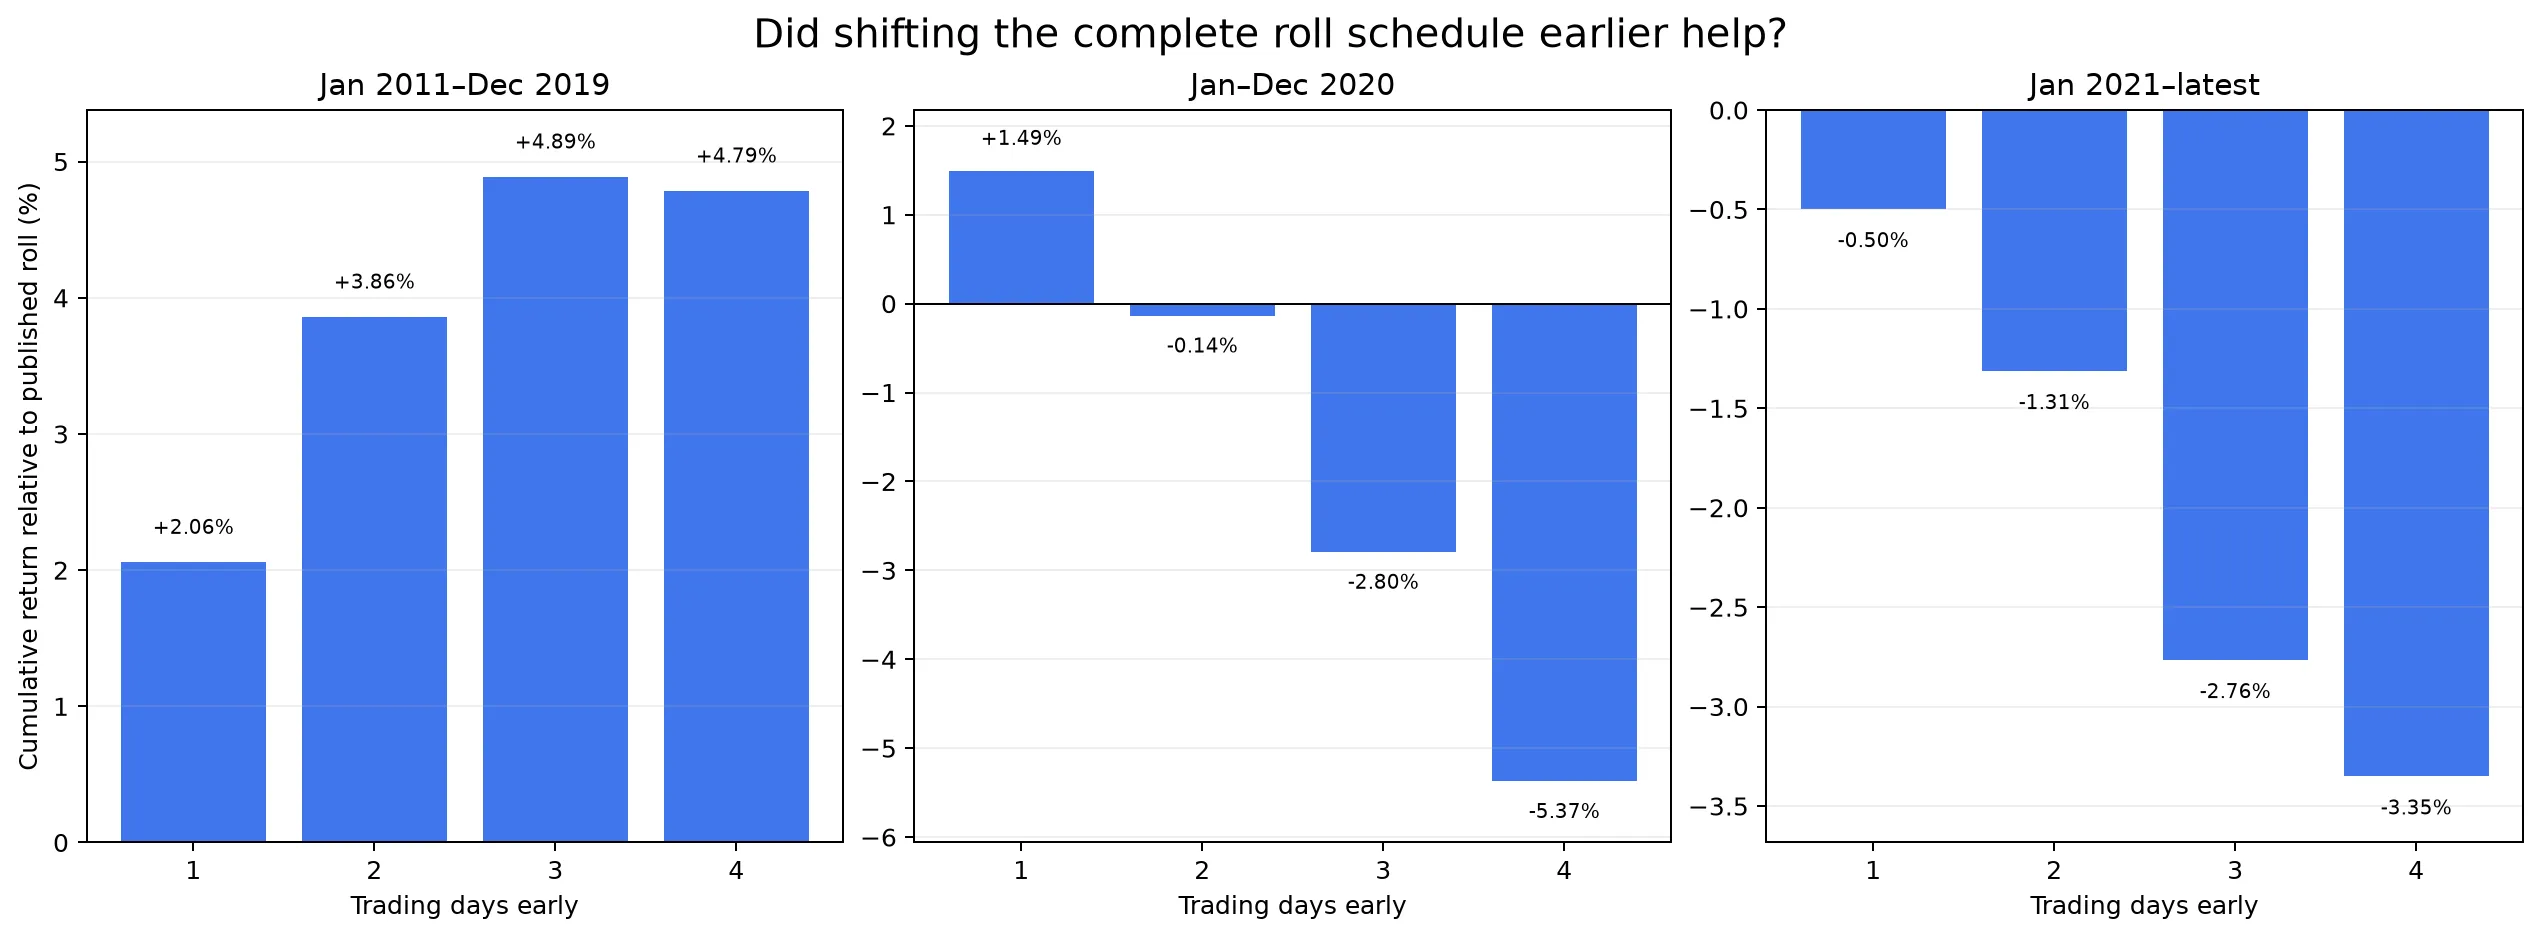
Before 2020, every early-roll strategy beat the published roll. The strongest result came from moving the schedule three days earlier, which added 4.89% of compounded relative wealth over almost nine years.
But it seems like the edge has eroded since…
Data and Implementation notes
The study uses daily observations from January 5, 2011 through August 14, 2026.
- WTI spot: EIA series
DCOILWTICO, downloaded through FRED. - First and second WTI futures: official EIA
RCLC1andRCLC2daily series through April 5, 2024. - Futures after April 5, 2024: delivery-specific WTI closes from Sina Finance, ranked into F1 and F2 using the NYMEX expiry calendar. These are public daily closes rather than official CME settlements.
- USO: Moomoo daily market prices, adjusted for the April 2020 one-for-eight reverse split.
- Collateral: FRED three-month Treasury yield
DGS3MO.
The futures splice uses returns calculated within each source. It never divides a Sina price by an EIA price, which would turn a vendor-level difference into a false daily return. Contract returns follow the same delivery month across adjacent dates.
USO departed from a simple front/second-month portfolio during the 2020 market disruption. The reconstructed benchmark follows the stated front-month roll rule; observed USO shows the shareholder experience. Their difference is intentional.
This is a historical research exercise, not investment or tax advice. Past performance does not establish that any roll strategy will work in the future (which we have shown, lol)
This entire project from conceptualisation to the blog post that you are reading, took just 1 day with AI.