Physical Commodities Trade Allocation as an Optimisation Game: Part 3
If you just chanced across my blog, here is a TLDR of what happened so far:
0/ I created a game simulating physical commodities trade allocations (which you can explore more here)
1/ I tried to make local models running on my mac mini play it, but they kept crashing (you can read more about this here)
2/ I then made more powerful models play the game here, and discovered that models are smart time traveling cheaters (i.e. I discovered look ahead bias).
3/ To address look ahead bias, I created synthetic years and ended up building a “Synthetic Year Generator” engine to systematically produce new years, which can be used for training/ eval purposes. This blog post discusses my explorations into synthetic data in depth.
Background
When I made AI models play my physical trading simulation game, I quickly discovered that many models were able to recognise that they were playing through a historical copper market, and decided to trade using the benefit of hindsight.
Changing the dates to the year 3000 was not enough to fool the models, though the relationship of inference spend to PnL generated became weaker compared to the non-date masked historical game.
This made me reflect on benchmark design, and specifically, how to design a benchmark for trade allocation decisions which evaluates the actual ability of models rather than how good the models are at cheating.
I reached the conclusion that one way to close the loophole of look-ahead bias, is to create an entirely synthetic simulated environment for the models to play in.
In this case, will be impossible for models to cheat (by pulling on their memory), because the year it is being tested on simply did not exist in real life. This also gives room to models to recall past events in their training sets which could be useful, in a “non-cheating” way, much how like a veteran trader draws from experience and to apply it to trading in the synthetic year.
The First Synthetic Year
The very first synthetic year was quickly generated by AI with almost no additional guidance on how to design the market environment (cough, AI, cough, slop). I wanted a quick proof of concept, was keen to see what AI could do, and was impatient to see the results.
This was what AI came up with, which was pretty impressive:
- LME prices generated with random log-price movement with 1.1% daily vol, CME priced as LME + US premium
- 11 fictional events and price drifts prescribed by each
Making AI play the first synthetic year
I made the same models play this first synthetic year, and the results are as follows:
| Model | Final PnL, USD millions | Estimated inference spend, USD |
|---|---|---|
| DeepSeek V4.1 Flash | 8.46 | 8.96 |
| Claude Fable 5.1 | 8.10 | 18.11 |
| GLM 5.3 Flash | 7.94 | 2.20 |
| GPT-6 Astra | 7.88 | 59.55 |
| GPT-6 Luna | 7.32 | 2.25 |
| Claude Opus 5.5 | 7.11 | 4.74 |
| GPT-6.1 Sol | 7.07 | 7.68 |
| Claude Haiku 5.5 | 6.48 | 1.78 |
| If you have been following my blog, you would recall that PnL from my previous results with AI were much higher. It is very tempting to immediately conclude that AI sucks when it couldn’t cheat. |
However, this is not an apples to apples comparison. I had changed the market, and this synthetic year had much smaller opportunities compared to the historical year.
To compare fairly, one way is to convert absolute PnL numbers into a score based on the “max possible PnL” for each year.
Finding Max Profit possible
Essentially we are looking for the answer to: “given perfect knowledge of what happens, how profitably could this game be played?”
I thought this would be easy, since it was a fixed bounded game, and there can only be one max profit number.
However, there’s actually so many possible decision paths that it becomes impractical to brute force through every possible path. For e.g. just the optional spot contract opportunities alone gives rise to over 36 quadrillion accept/reject combinations, before choosing cargo quantities, booking dates and hedge changes.
| Hypothetical speed | Time needed |
|---|---|
| One complete game per second | 1.14 billion years |
| One million complete games per second | 1,142 years |
| I can’t wait a 1000 years for this. |
To circumvent this, HiGHS was used as a solver. (quick note here: I’ve done well for stats courses at NUS but I’m not a math grad. HiGHs is new to me and was proposed by AI, and here I’m learning from what AI is telling me to do.)
HiGHs avoids the need to test every possible trading path by dividing the trading strategies into groups and then discarding any group that cannot beat an already-found strategy, and then splitting promising groups further.
Hence, to find max PnL:
- I translate the trading choices into math,
- get HiGHS to find the optimistic max with relaxed trading restrictions (checked ceiling),
- translate that HiGHS path into playable strategy, and
- run it in the game to verify (achievable profit).
There will be a range between the higher checked ceiling vs the game verified achievable profit, in which the true perfect-foresight max will lie. To save compute, I do not solve down to a specific number, but a “good (narrow) enough” range.
While the ceiling value is not a proven attainable maximum, I choose to use this in the standardised score calculations as it is an upper bound and thus a more conservative denominator.
Standardised Scores
We convert the results of our runs into a standardised score: each model’s PnL divided by the checked profit ceiling for that game version.
Finally, we can see the results in an apples to apples comparison!
The cost axis is logarithmic.
The results are super interesting. It is apparent that the inference spend to PnL relationship breaks down significantly, if the game is based on only synthetic data.
But I wasn’t fully satisfied to accept this conclusion just yet.
Nitpicks on AI Generated Game Design
What if the problem was that the AI generated game year was just too sloppy and unrealistic to be played properly? i.e. was it a problem with game design rather than the models?
While the first AI generated year might look impressive, I felt that it didn’t fully meet my standards. Some of my nitpicks:
- The way prices reacted to strike news didn’t look right to me, prices should have spiked up immediately. Same for how fast prices should have reacted on news of wage agreement.
- On May 20, Shanghai to NOLA freight dropped when news says transpacific rates are rising.
- The news events had trading advice and explanations of implementation mechanics that were helping AI models, when players should be interpreting the news themselves.
Maybe I am being particular, but I felt that AI didn’t have “taste”.
Handcrafted Artisanal Years
Humans have taste. It is also fun for a human to “play God” when designing synthetic trading years, but it is seriously time consuming to manually review each year.
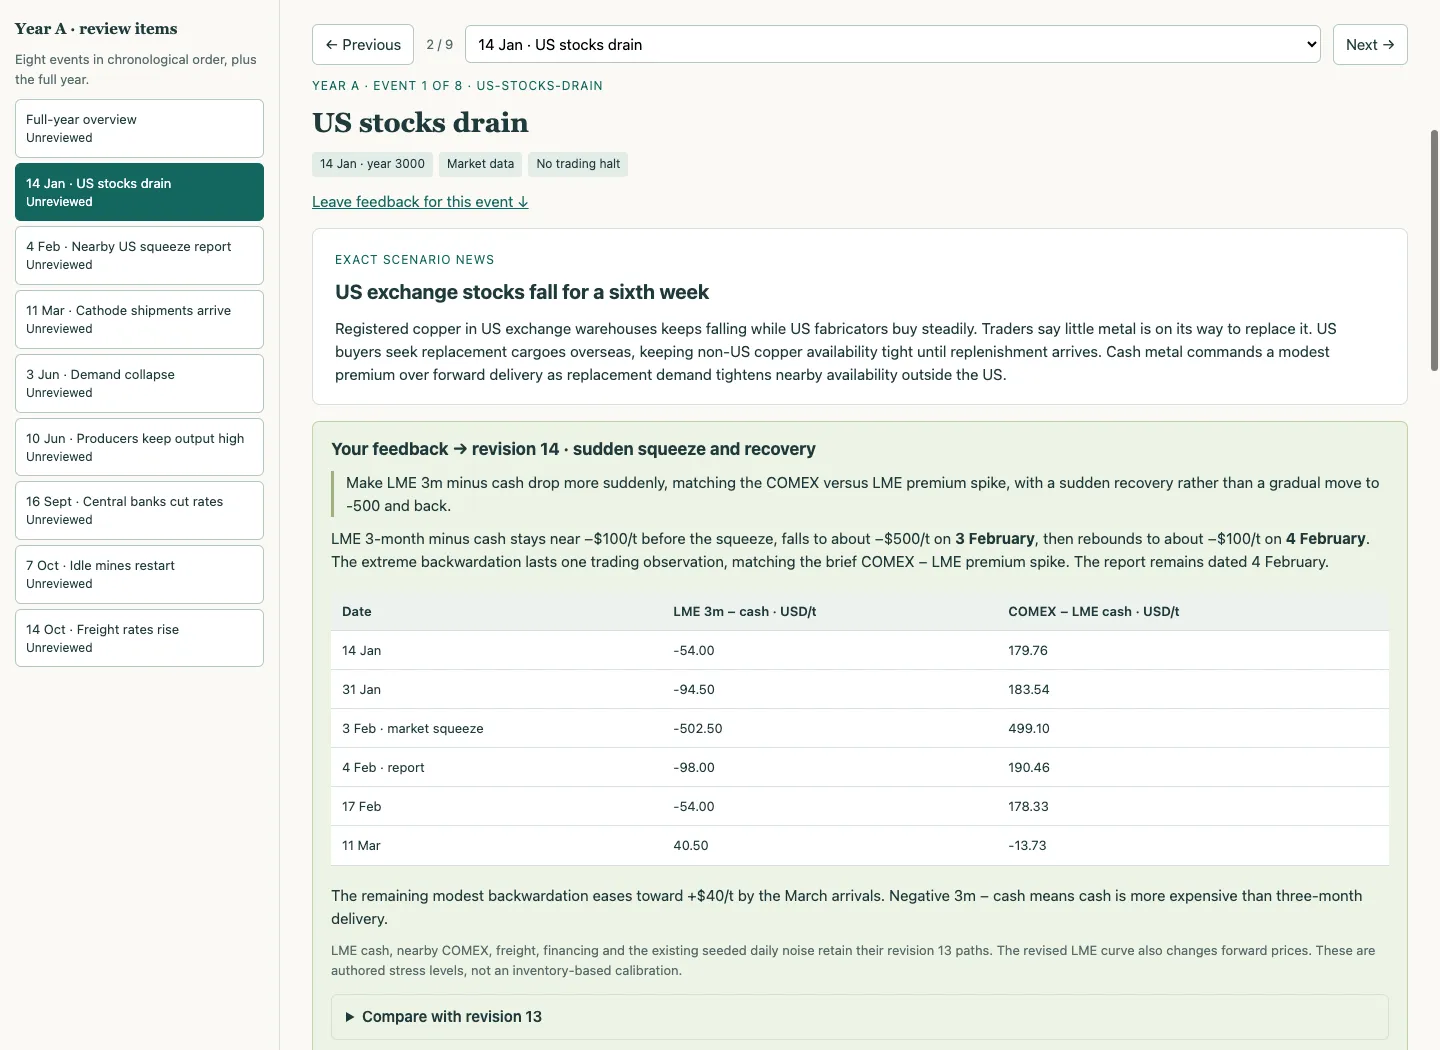
To make the process more efficient, I created a system where I had AI churn out rough timelines, and then reviewed each year in detail via a custom feedback dashboard.
Custom Feedback Dashboard for Reviewing Synthetic Years
Having freewill and tokens is amazing, because now I could create a dashboard tool (which would have taken weeks in the past) just because I didn’t want to go back and forth between charts, news descriptions and a chat window.
Each year had a full-year overview and a list of events I could work through individually. Clicking an event brought up the exact news text, the assumptions behind its market impact, and charts showing what actually happened.
This made my nitpicks much easier to identify and explain.
Below each event, I could mark it as “Looks sensible”, “Needs changes” or “Question”, and leave a note. The dashboard saved my notes locally and allowed me to export the feedback back to AI in bulk.
Synthetic Years A, B, C
After a locked-in day, the final reviewed synthetic years were as below:
Performance Results
With much anticipation, I reran the models to play the handcrafted years A, B, C.
The first thing that stands out is that the handcrafted synthetic years performed poorly, even worse than the first synthetic year (the unreviewed AI generated game)
This reinforces the conclusion that some of the apparent advantages of the more expensive models may come from recognising what happens next, rather than making better decisions with the information available at the time.
Or in other words, when you pay more for expensive models to do this specific task, your are paying for their ability to “cheat better” rather than their actual ability when they cannot “cheat”.
Plotting each game’s least-squares lines, we can clearly see much flatter slopes for the synthetic data games:
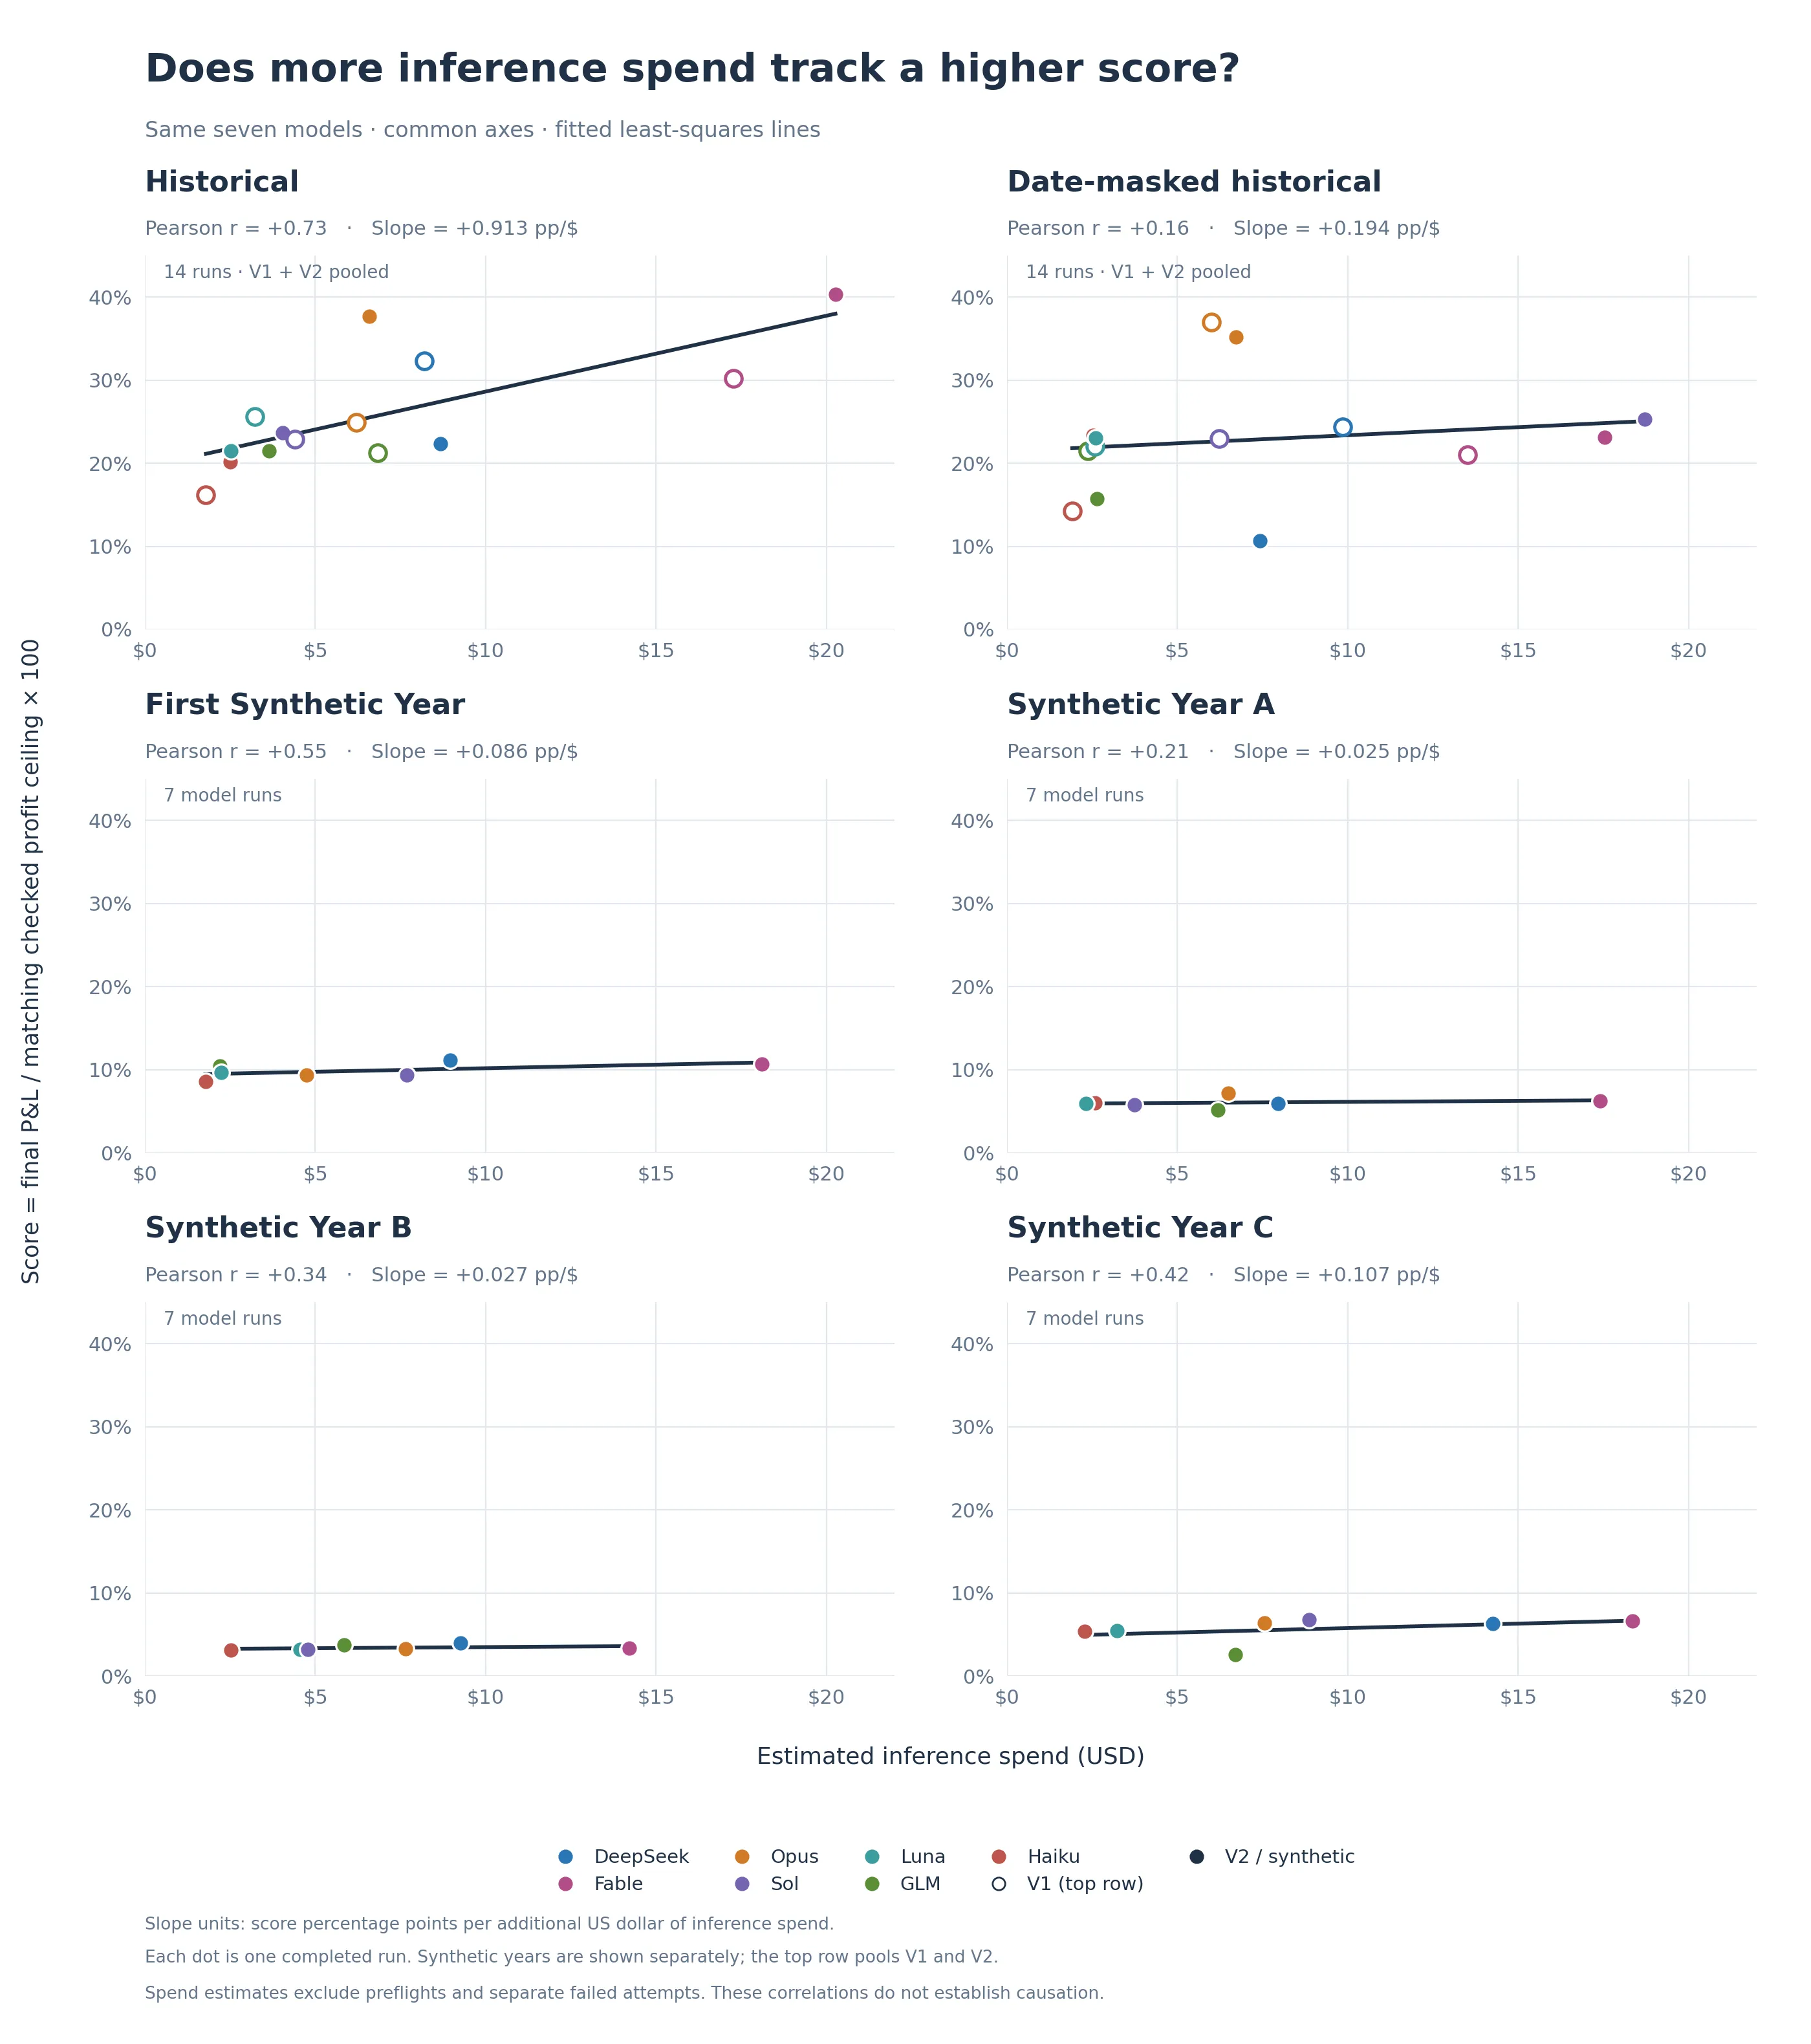
Slope reports the fitted difference in score percentage points per additional $1 of inference spend; Pearson r measures how closely the points follow a straight-line relationship.
While this may come as an immediate disappointment to physical commodity traders, I actually think this presents as a huge potential opportunity for whoever is able to train AI to do it. Whoever can do it fastest will be able to unlock a huge advantage in physical commodities trading.
The Data Dilemma
The most important ingredient needed in model training is data. Commodity trading houses likely hold the most valuable training data, but it is proprietary and fiercely guarded. That actually puts them in a strong position to train models for physical trading, if they are willing to invest.
Realistically, however, I am uncertain of their appetite to do so today. I do already see trading houses using AI to build dashboards and write code, but training models and developing rigorous evaluations would require specialist teams, which at this point will mean competing with AI labs for talent.
In my mind, the big labs would still be the ones to take the lead, to develop something that can have some degree of convincing performance first and then collaborate with the commodities industry.
The question then is, how do the labs get training data to start training? The answer in my mind is synthetic data. Creating synthetic years at scale becomes a key problem to solve.
Synthetic Year Generator
The process of reviewing the synthetic years was fun at first but then started feeling tedious after about 15 mins. I wanted to find a way of generating synthetic years which was more efficient and systematic than doing human reviews on prompt generated worlds, but still preserved some degree of taste and realism.
My solution was to create a “Synthetic Year Generator”, built based on a reviewed catalogue of possible events and outcomes, that could be pieced together to form various combinations of a full year.
Event families and possible paths
I created a catalogue of 25 event distinct families. An event family contains all its possible sequence of developments, news templates, affected regions, and numerical assumptions.
A mine negotiation, for example, makes up one event family which contains various permitted paths:
- Talks lead directly to an agreement.
- Workers vote to strike, but a last-minute agreement prevents a stoppage.
- Production stops, followed by an early settlement.
- The strike is extended, before an eventual settlement and recovery.
Each permitted path leads to different outcomes which become reflected in price paths, freight rates, interest rates, etc. depending on the event.
Piecing together a Synthetic Year
I created an interface which allows me to decide how many events I want to include in a year, how many can overlap, and a random seed (which decides the decision path). Additional features include specifying specific events which must happen, and possibility to force certain event paths, which can be useful for scenario stress testing. Recipes for each year can be pinned and hence recreated exactly.
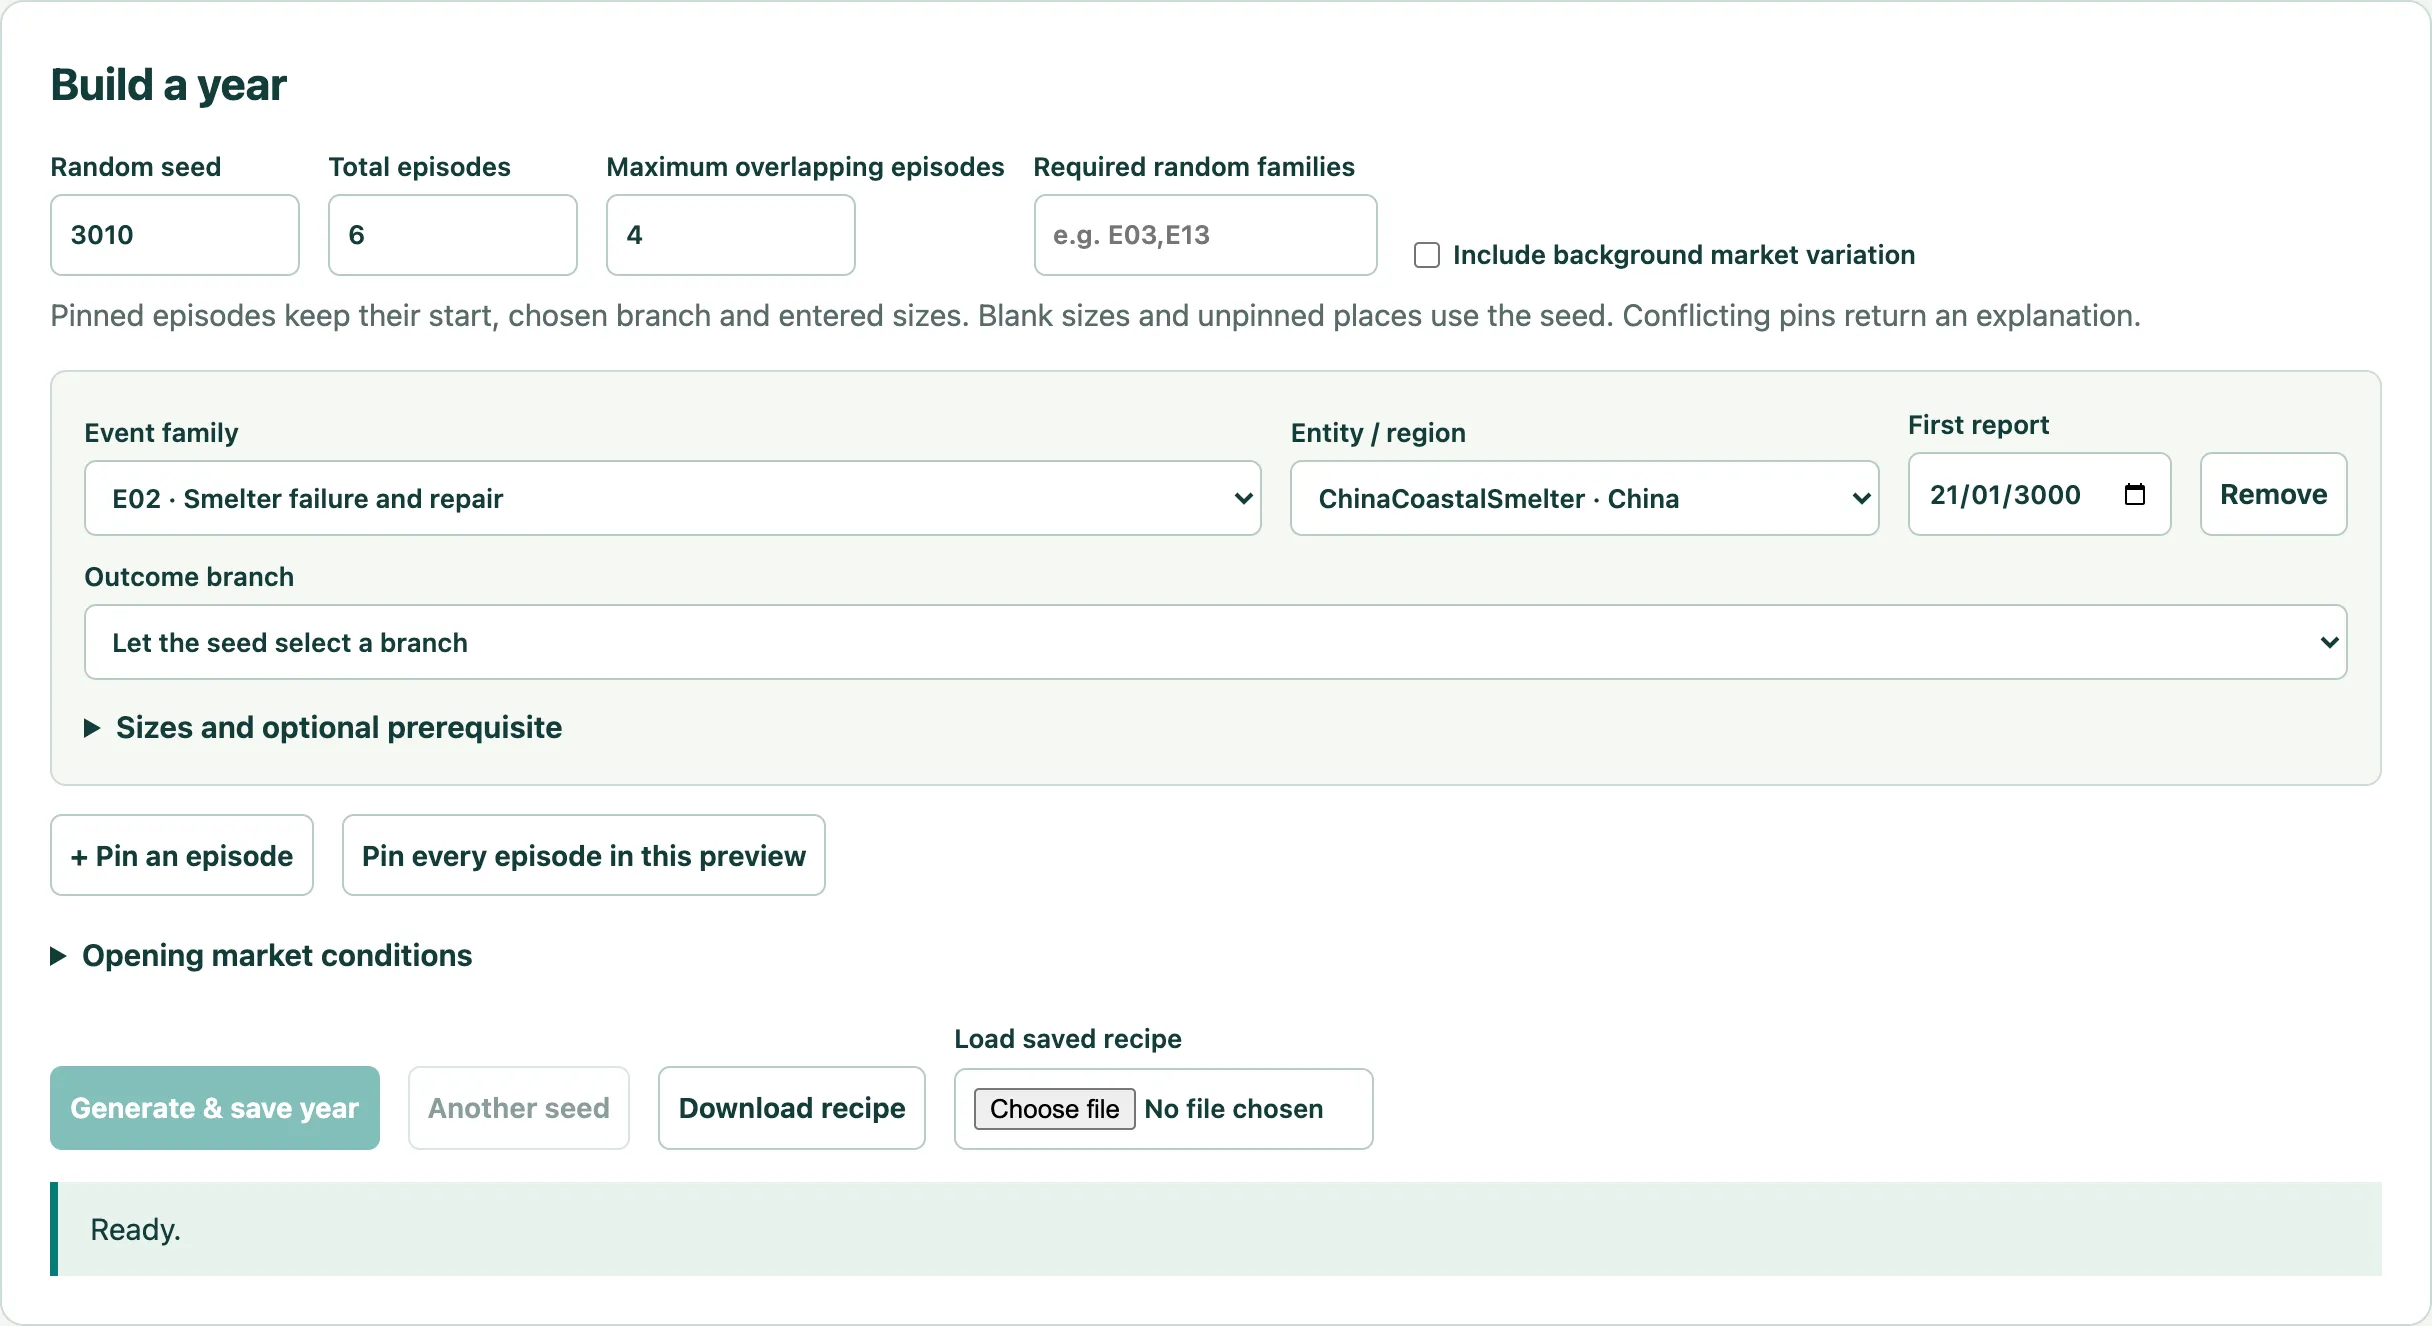
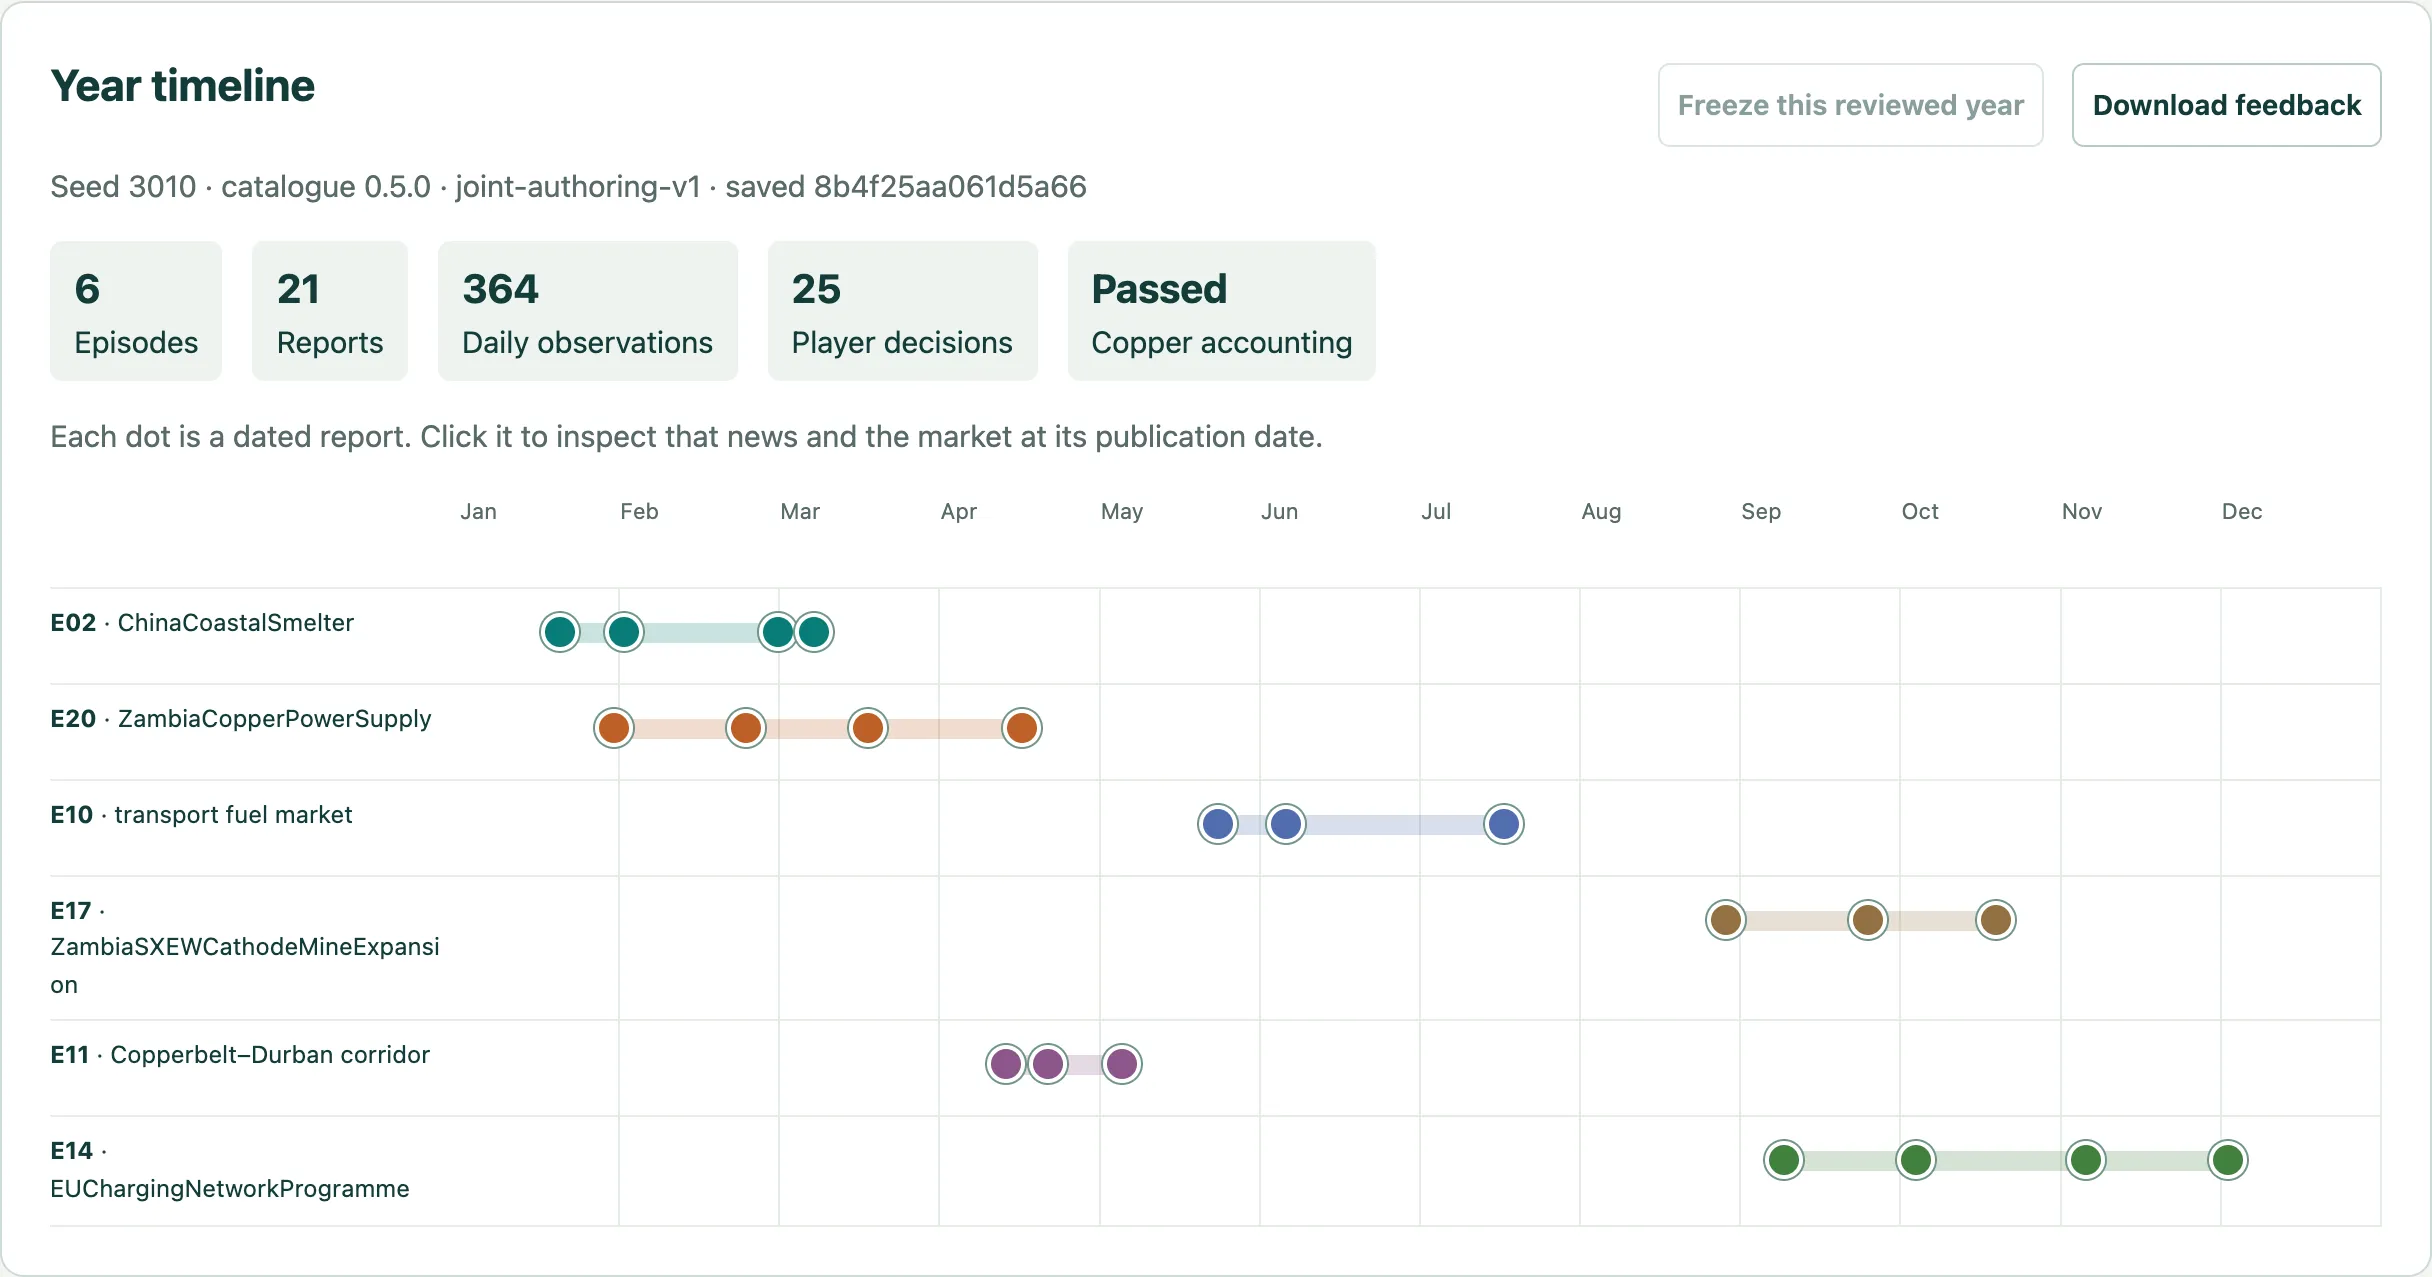
Each row is an episode; each dot is a report along its selected branch. Several stories can unfold at once.
All the selected episodes feed into one shared simulated market. Hence two events can reinforce or offset each other. The engine moves forward day by day, updating production, consumption, accessible stocks, expectations, financing and shipping.